See the shape of a week.
A data visualization study uses a fictional series of library visits to explore how annotation changes what a chart communicates.
Explore the values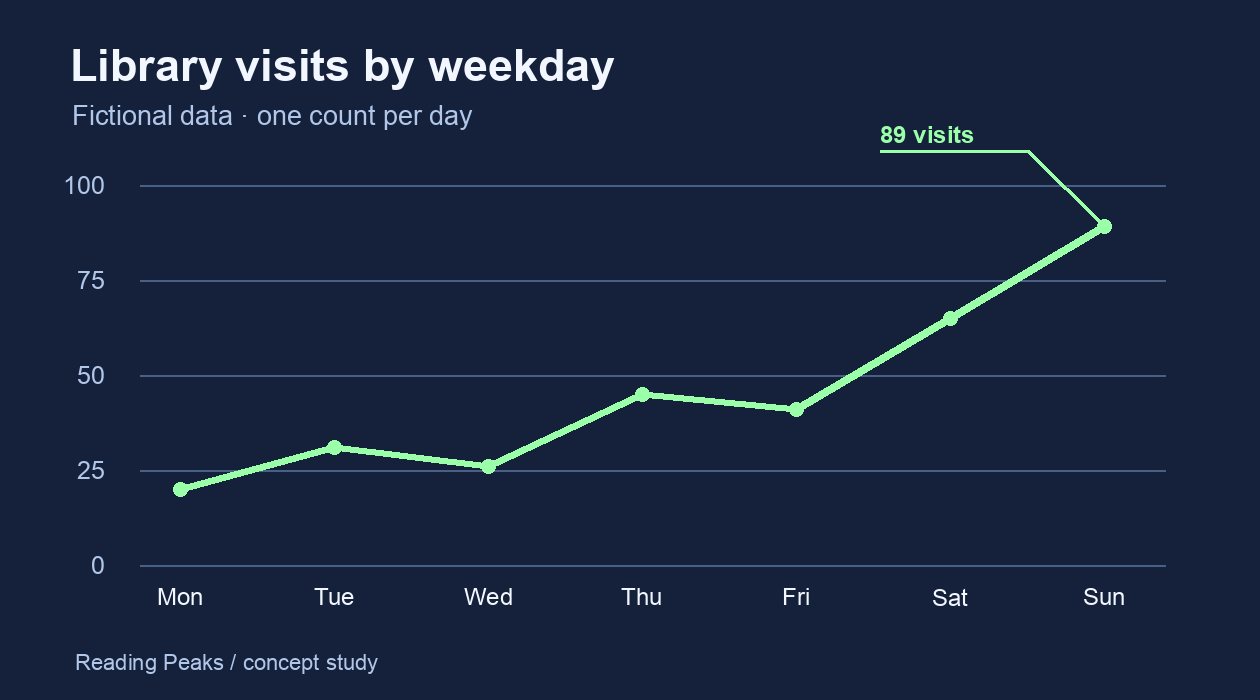
A data visualization study uses a fictional series of library visits to explore how annotation changes what a chart communicates.
Explore the values