Reading Peaks
A chart of fictional library visits. A line establishes the weekly pattern and a short annotation identifies the largest count.
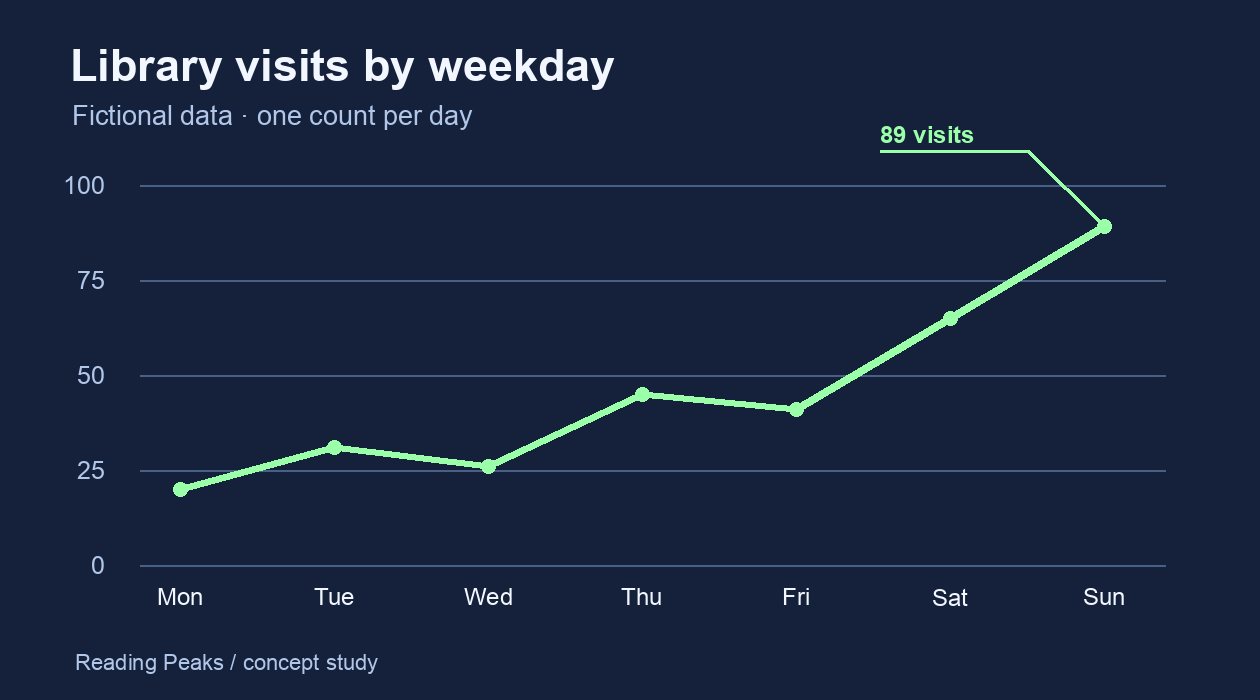
| Day | Visits |
|---|---|
| Monday | 20 |
| Tuesday | 31 |
| Wednesday | 26 |
| Thursday | 45 |
| Friday | 41 |
| Saturday | 65 |
| Sunday | 89 |
Keep the scale visible
The vertical scale starts at zero and every plotted point represents one day on the same footing. A fixed interval gives viewers a reference for the jump between Saturday and Sunday. The numbers were chosen for the exercise.
Put the label beside the event
A dot, caption and short leader tie the annotation to Sunday. Repeating the count in a table lets someone find the value without reading the line or distinguishing its color. The chart avoids inferring why visitors came.